


How to Improve Your Trading Performance Using Data Analytics
Every trader wants to improve.
Few know what to improve.
They change strategies, add indicators, or switch markets — hoping something sticks. It's improvement by guesswork.
Data analytics replaces guesswork with a process.
Instead of asking “What should I try next?” you ask “What does my data say is costing me money?”
This guide gives you a practical framework for using analytics to improve your trading.
The Analytics Mindset
Think of your trading like a business.
A business doesn't just look at revenue. It looks at costs, margins, which products sell, and which customers are profitable.
Your trades are the same.
- Your setups are your products
- Your losses are your costs
- Your expectancy is your margin
- Your mistakes are leaks in the system
Analytics shows you which parts of the business are working.
Step 1: Build a Clean Dataset
Bad data leads to bad conclusions.
Before analyzing anything, make sure:
- Every trade is logged — winners and losers
- Every trade has a strategy tag
- Risk is recorded consistently (ideally in R)
- Session, market, and rule compliance are captured
Missing trades or inconsistent tags make every insight unreliable.
Step 2: Establish Your Baseline
Before you change anything, measure where you are.
Record your current:
- Win rate
- Average win and average loss
- Expectancy per trade
- Profit factor
- Maximum drawdown
- Rule compliance rate
This is your starting point. Every future change gets judged against it. If you're unsure what each number means, see 10 trading metrics every trader should track.
Step 3: Find Your Biggest Leak
Don't try to fix everything.
Find the one area costing you the most.
A simple method: for each segment of your trading, calculate total R gained or lost.
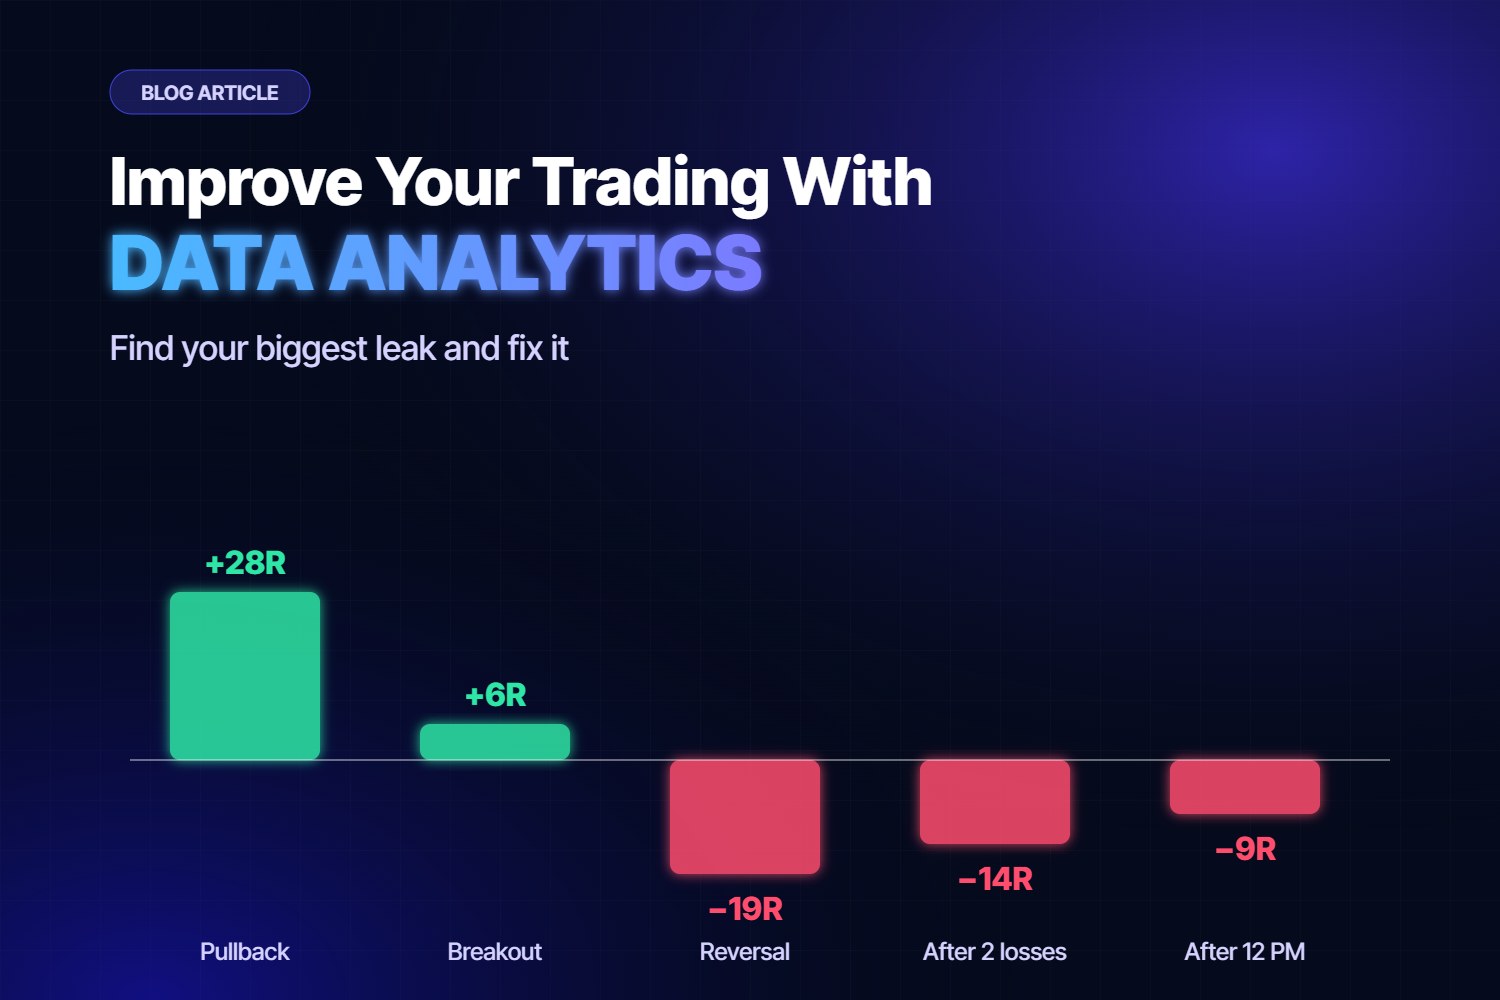
Example breakdown over 150 trades:
- Setup A (trend pullback): +28R
- Setup B (breakout): +6R
- Setup C (counter-trend reversal): −19R
- Trades after 2 consecutive losses: −14R
- Trades after 12 PM EST: −9R
This trader doesn't need a new strategy.
They need to stop trading Setup C, stop after two losses, and stop trading after noon.
That's potentially +42R recovered — without finding a single new trade.
Step 4: Separate Strategy Problems from Execution Problems
This is one of the most powerful things analytics can do.
Split your trades into two groups:
- Trades where you followed your rules
- Trades where you broke them
Compare the expectancy of each group.
If rule-following trades are profitable and rule-breaking trades aren't, your strategy is fine. Your problem is discipline, and tracking your emotions will show what triggers it.
If both groups lose, your strategy needs work.
Knowing which problem you have saves months of fixing the wrong thing.
Step 5: Make One Change at a Time
When traders find several problems, they often change everything at once.
Then they can't tell what helped.
Instead:
- Pick the biggest leak
- Create one rule to address it
- Trade 30–50 trades with that rule
- Compare results to your baseline
- Keep it, adjust it, or drop it
Slow, controlled changes build a system you understand.
Step 6: Watch Trends, Not Single Weeks
One bad week means very little.
Look at rolling metrics — for example, your expectancy over the last 50 trades.
A rolling view helps you:
- Spot genuine improvement
- Detect when an edge is fading
- Avoid overreacting to normal variance
Step 7: Turn Insights into Rules
Analytics is only valuable if it changes your behavior.
Every insight should become a written rule:
- “Counter-trend trades lose money” → No counter-trend trades.
- “I lose after two losses” → Stop trading for the day after two losses.
- “London is my best session” → Trade only 3 AM – 11 AM EST.
Insight without a rule is just trivia.
Common Analytics Mistakes
- Reacting to small samples — 10 trades isn't a pattern
- Too many filters — slicing data so thin every segment is noise
- Looking only at P&L — ignoring behavior and compliance
- Analyzing but never acting
- Changing rules too often to evaluate them
How Clarity Tracking Powers This Process
Clarity Tracking is designed for exactly this kind of analysis.
It helps you:
- Automatically log every trade
- Segment performance by strategy, session, and market
- Measure expectancy and drawdown
- Compare rule-following vs. rule-breaking trades
- Spot behavioral patterns over time
You spend less time building reports and more time acting on them.
Final Thoughts
Improvement in trading rarely comes from discovering something new.
It usually comes from removing what isn't working.
Measure your baseline.
Find your biggest leak.
Fix one thing at a time.
Let the data confirm it.
Repeat that cycle and progress stops being luck.
It becomes a process.
Frequently Asked Questions
How many trades do I need before analyzing my data?
Aim for at least 50 to 100 trades overall, and 30 to 50 in any segment you want to judge, such as a single setup or session. Smaller samples are mostly noise.
How do I know if my problem is the strategy or my execution?
Compare trades where you followed your rules with trades where you broke them. If the rule-following trades are profitable, the strategy works and the problem is execution. If both groups lose, the strategy needs work.
How often should I change my trading rules?
Change one thing at a time and give it 30 to 50 trades before judging it against your baseline. Changing several rules at once makes it impossible to tell what helped.
Related Articles
Take Control of Your Trading Performance
Stop guessing. Start knowing. Track every trade, understand your numbers, and build real consistency with Clarity Tracking.


